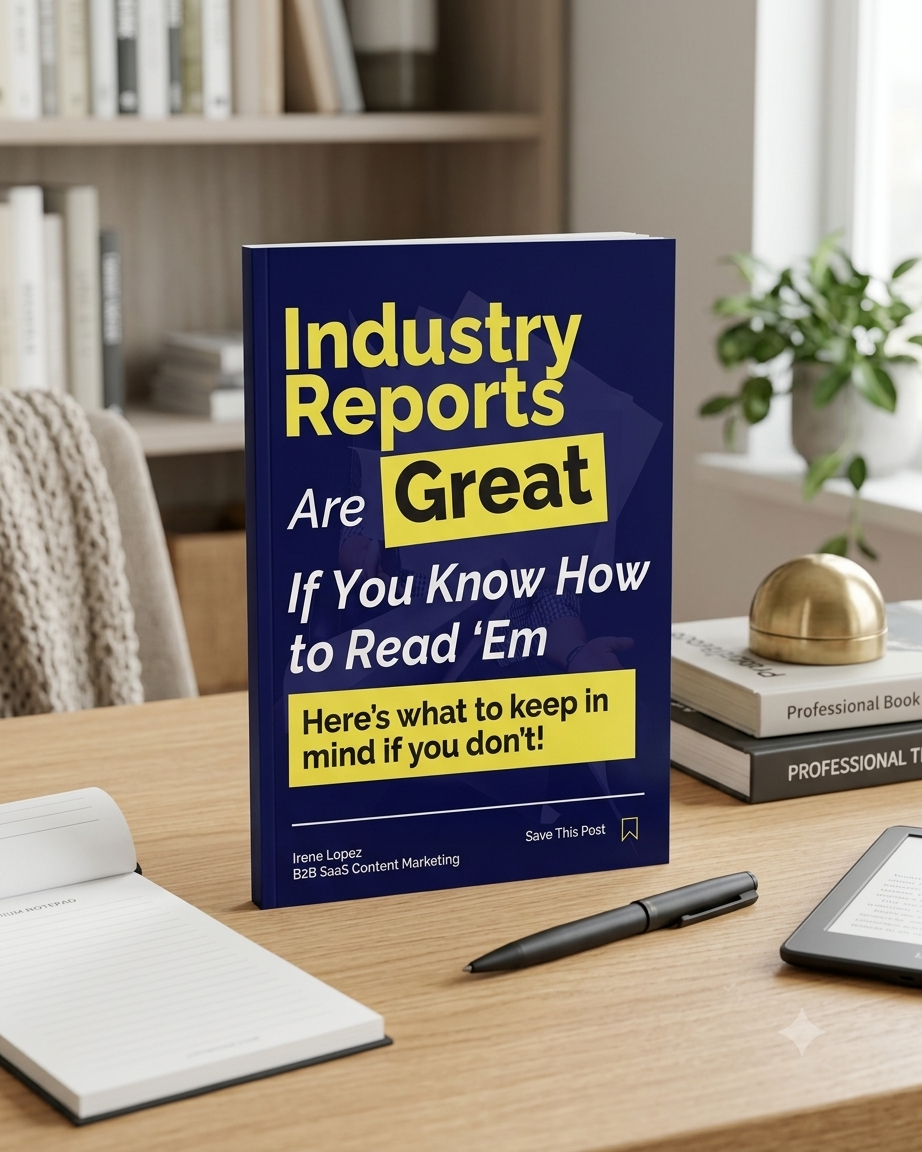
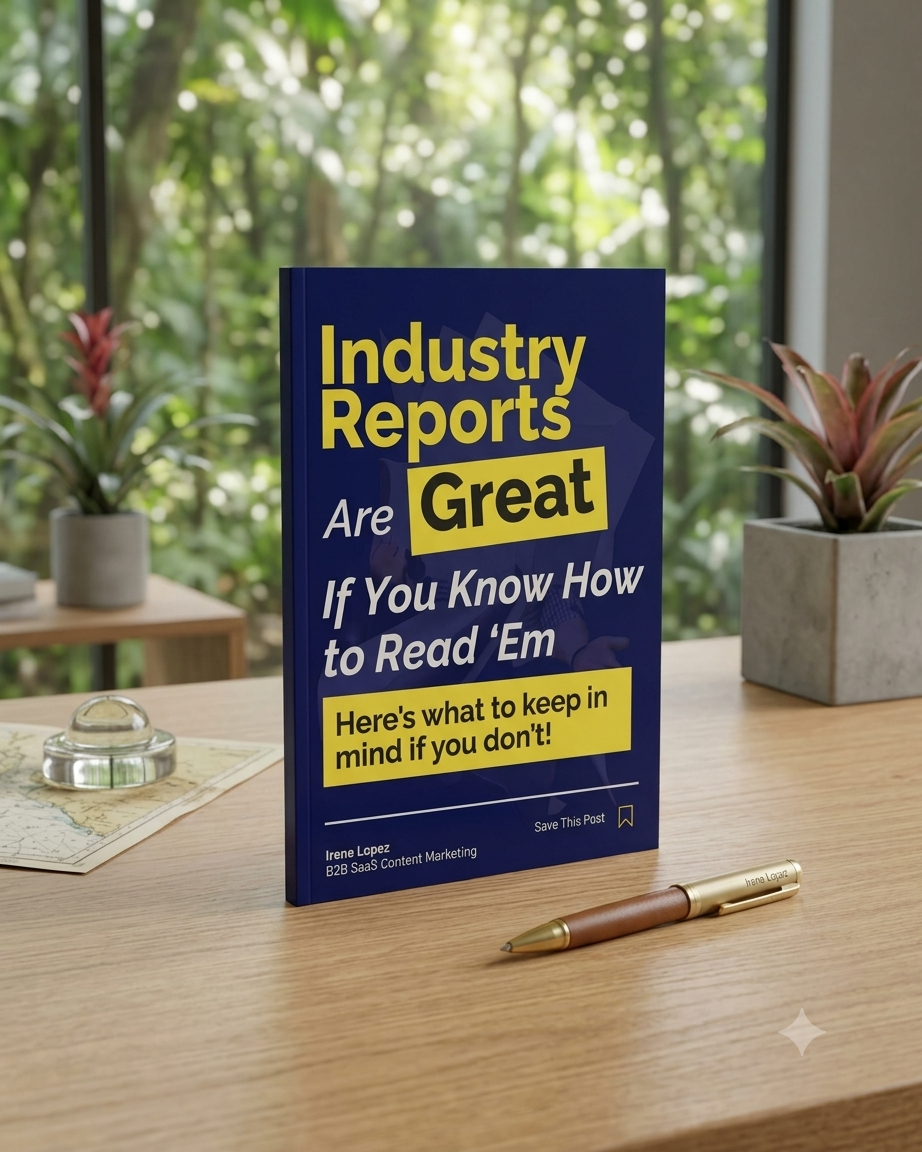
Industry Reports Are Great If You Know How to Read Them
A 19-page guide for B2B SaaS founders who want to make smarter decisions from the data everyone else takes at face value
Every “State of…” report promises insight. Few tell you whether it applies to you.
You’ve seen the headlines: “70% of marketing leaders are increasing AI investment.” “Top-performing teams publish more content.” It’s tempting to treat them as a playbook. But most industry reports are built on broad survey data, and what’s true in general isn’t always what will work for your business.
This quick-read guide from B2B content strategist Irene Lopez shows you how to read industry reports critically, so you can pull out what’s useful, spot what’s misleading, and stop making budget and channel decisions based on what merely sounds important.
You’ll shift from: “This says X, so we should do X.”
To: “Under what conditions would this be true?”
This guide is for you if:
- You’re a founder or decision-maker who uses benchmark and trend reports to guide strategy
- You’ve ever changed your marketing plan because of a headline stat
- You want to separate real market signals from vendor-friendly narratives
- You’d rather spend your budget on what works than on what’s trending
What’s Inside: 6 Ways to Read Reports Like a Strategist
1. Start With the Source
Learn how the publisher’s product, data access, and market category shape the story a report tells.
Benefit: Ask “Who is this most relevant to?” instead of “Is this correct?” and know instantly how much weight to give a finding.
2. Look at the Sample
See why a stat from enterprise CMOs in the US may not transfer to your 20-person startup.
Benefit: Avoid applying conclusions from companies that look nothing like yours.
3. Understand the Data Type
Tell the difference between self-reported opinions and behavioral data like conversions, clicks, and pipeline.
Benefit: Focus on what the market is actually doing, not just what it says it values.
4. Check What the Questions Were
Spot leading questions, vague terms like “effective” or “high-performing,” and framing that nudges respondents toward an answer.
Benefit: Recognize when a headline number is a product of the survey design, not reality.
5. Separate Correlation From Causation
Understand why “companies that publish more also get more leads” doesn’t prove volume drove the growth.
Benefit: Decide how aggressively to act on an insight before you commit resources.
6. Look for What’s Missing
Learn what strong reports disclose (methodology, limitations, context) and what it means when they don’t.
Benefit: Judge how reliable and transferable a report’s conclusions really are.
Bonus: How to Actually Use Industry Reports
A simple framework for using them to spot patterns, test assumptions, and add context, without letting them replace your own customer knowledge.
What You’ll Walk Away With
- A repeatable checklist for evaluating any industry report in minutes
- Sharper instincts for spotting biased or misleading data
- More confidence defending (or challenging) strategy decisions in the room
- A smarter way to use benchmarks without being led by them
Why It Works
The value isn’t in the report itself. It’s in how you interpret it.
About the author: Irene Lopez is a B2B SaaS content strategist with 10+ years of experience helping SaaS and tech founders turn clear positioning and content into real business growth.